360 degree analytics
Lets look at few analytical models applied in Retail Industry
Market Basket Analysis
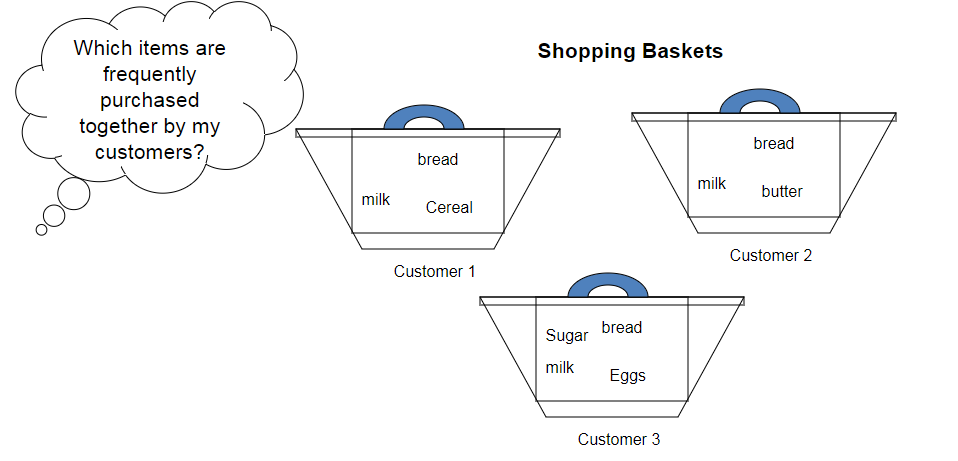
Frequent itemset mining leads to the discovery of associations and correlations among items in large transactional or relational data sets. Market basket analyzes customer buying habits by finding associations between the different items that customers place in their “shopping baskets”. This helps retailers develop marketing strategies by gaining insight into which items are frequently purchased together by customers.

Forecasting Horizons
Long Term
5+ years into the future
R&D, plant location, product planning
Principally judgement-based
Medium Term
1 to 2 years
Aggregate planning, capacity planning, sales forecasts
Mixture of quantitative methods and judgement
Short Term
1 day to 1 year, less then 1 season
Demand forecasting, staffing levels, purchasing, Inventory levels
Quantitative methods
Types of Forecasting Models
Types Of forecasts
Qualitative – based on experience, judgement, knowledge
Quantitative – based on data, statistics
Methods of Forecasting
Formal Methods – systematically reduce forecasting errors
Time series models (eg. Exponential smoothing)
Causal medels (e.g. regression)
Assumptions of Time Series Models
There is information about the past
This information can be quantified in the form of data
The pattern of the past will continue into the future
Short Term Forecasting Needs and Uses
Scheduling existing resources
How many employees do we need and when?
How much product should we make in anticipation of demand?
Acquiring additional resources
When are we going to run out of capacity?
How many more people will we need?
How large will our back orders be?
Determining what resources are needed
What kind of machines will we require
Which services are growing in demand? Declining?
What kind of people should we be hiring?

Techniques of Averaging
Moving Average
A technique that averages a number of recent actual values, updates as new values become available
Weighted Moving average
More recent values in a series are given more weight in computing the forecast
Exponential smoothing
The most recent observations might have the highest predictive value.
Therefore, we should give more weights to the more recent time periods when forecasting
Techniques for Trends
Develop an equation that will suitably describe trend, when trend is present
The trend component may be linear or nonlinear
Linear trend equation
Ft = a + bT
Ft = Forecast for period T
T = Specified number of time periods
a = Value of Ft at T = 0
b = Slope of the line
Error Measures
Error – Difference between actual value and predicted value
Mean Absolute Deviation (MAD)
Average absolute error
Mean Squared error (MSE)
Average of squared error
Mean absolute percent error (MAPE)
Average absolute percent error
